After our stormy December weather and a very dry January, people are naturally wondering, “What’s happening?” While no one can predict how much rain and snow may fall in the next few months, it does have many of us wondering if this variable weather is the new normal in California.
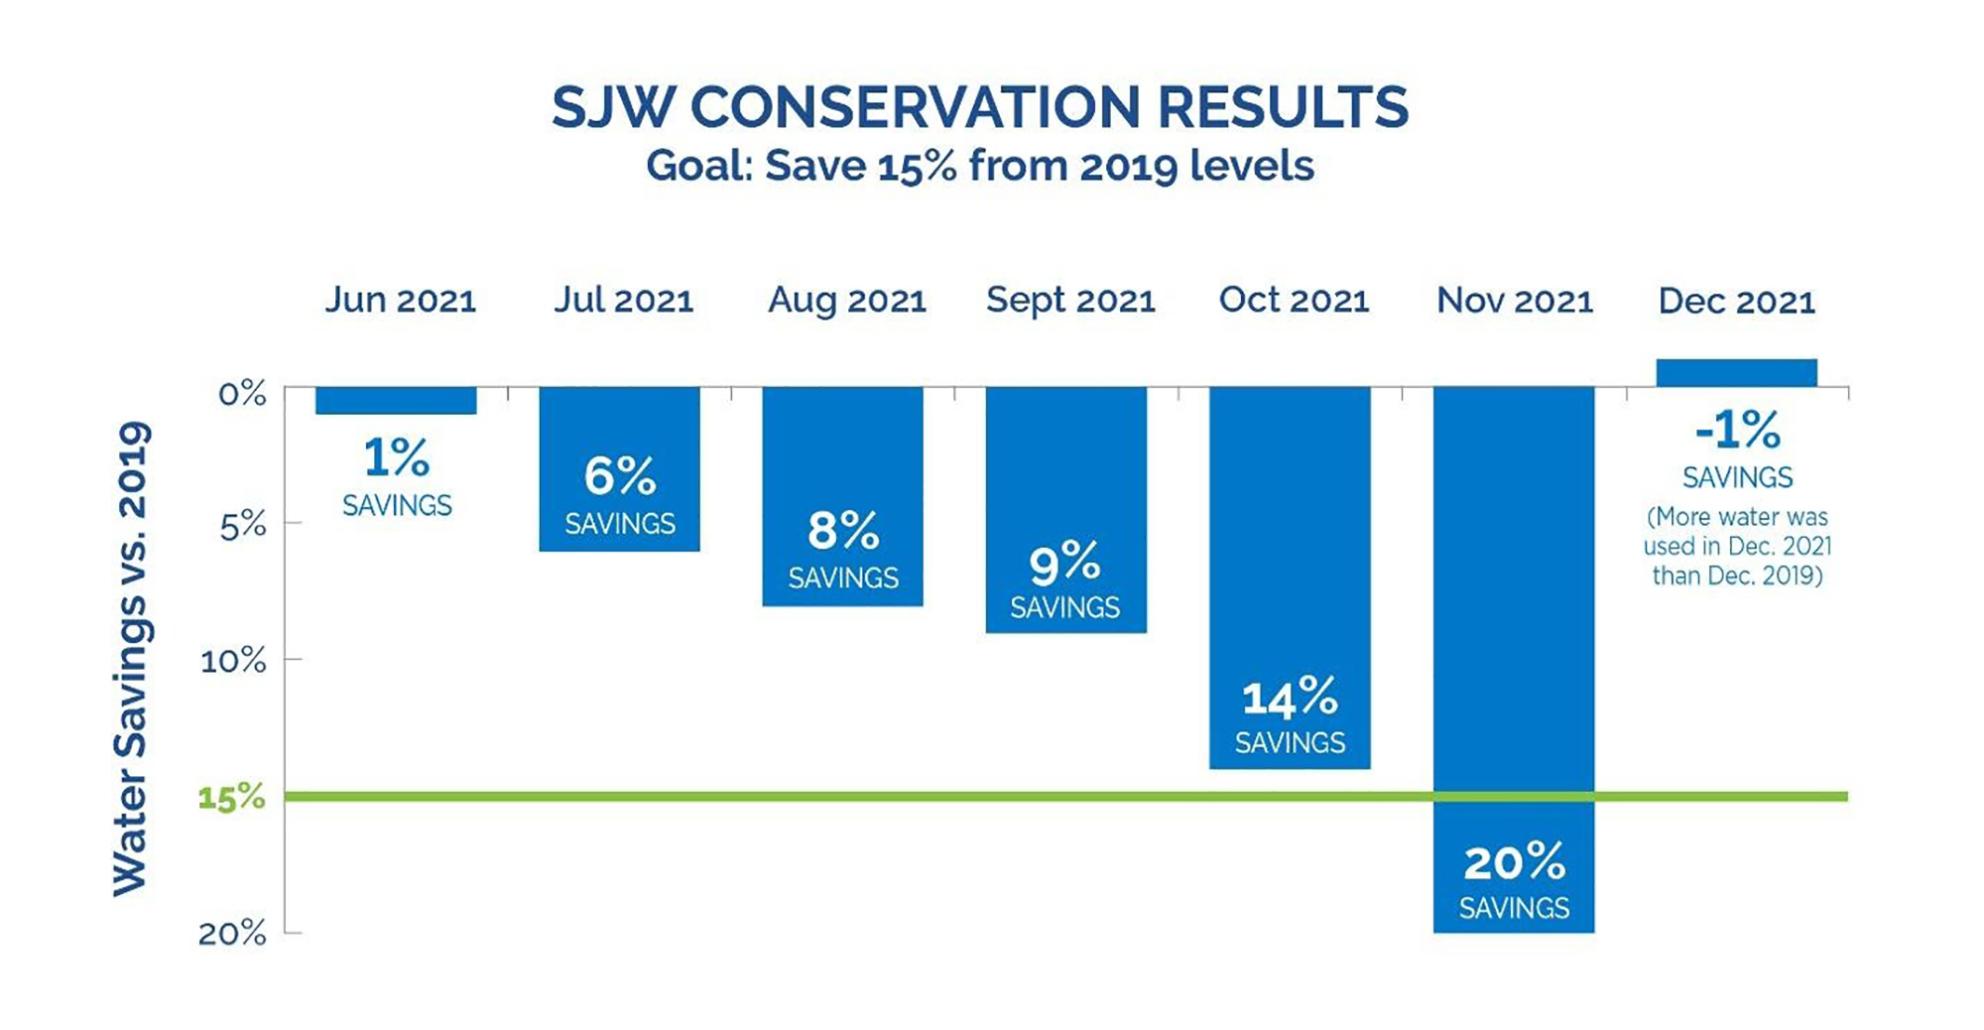
December Conservation Results
In December 2021, customer usage was up 1% from 2019 usage during the same month. What this means is that while customers used 20% less water in November, they actually rebounded in December by using 1% more water (than December of 2019). However, there’s “more” to this than meets the eye.

In December 2019, the weather was cold and wet in our service area. Usage throughout out system was down because there was no need for outdoor irrigation – a contrast from summer when up to 50% of usage is for outdoor use. Thus, most usage in December was for indoor consumption.
It’s difficult to cut back water use significantly when there’s only indoor usage. More efficient appliances like washing machines, dishwashers, toilets, and faucets mean that many residences are already hitting peak indoor savings.
Historic Perspective
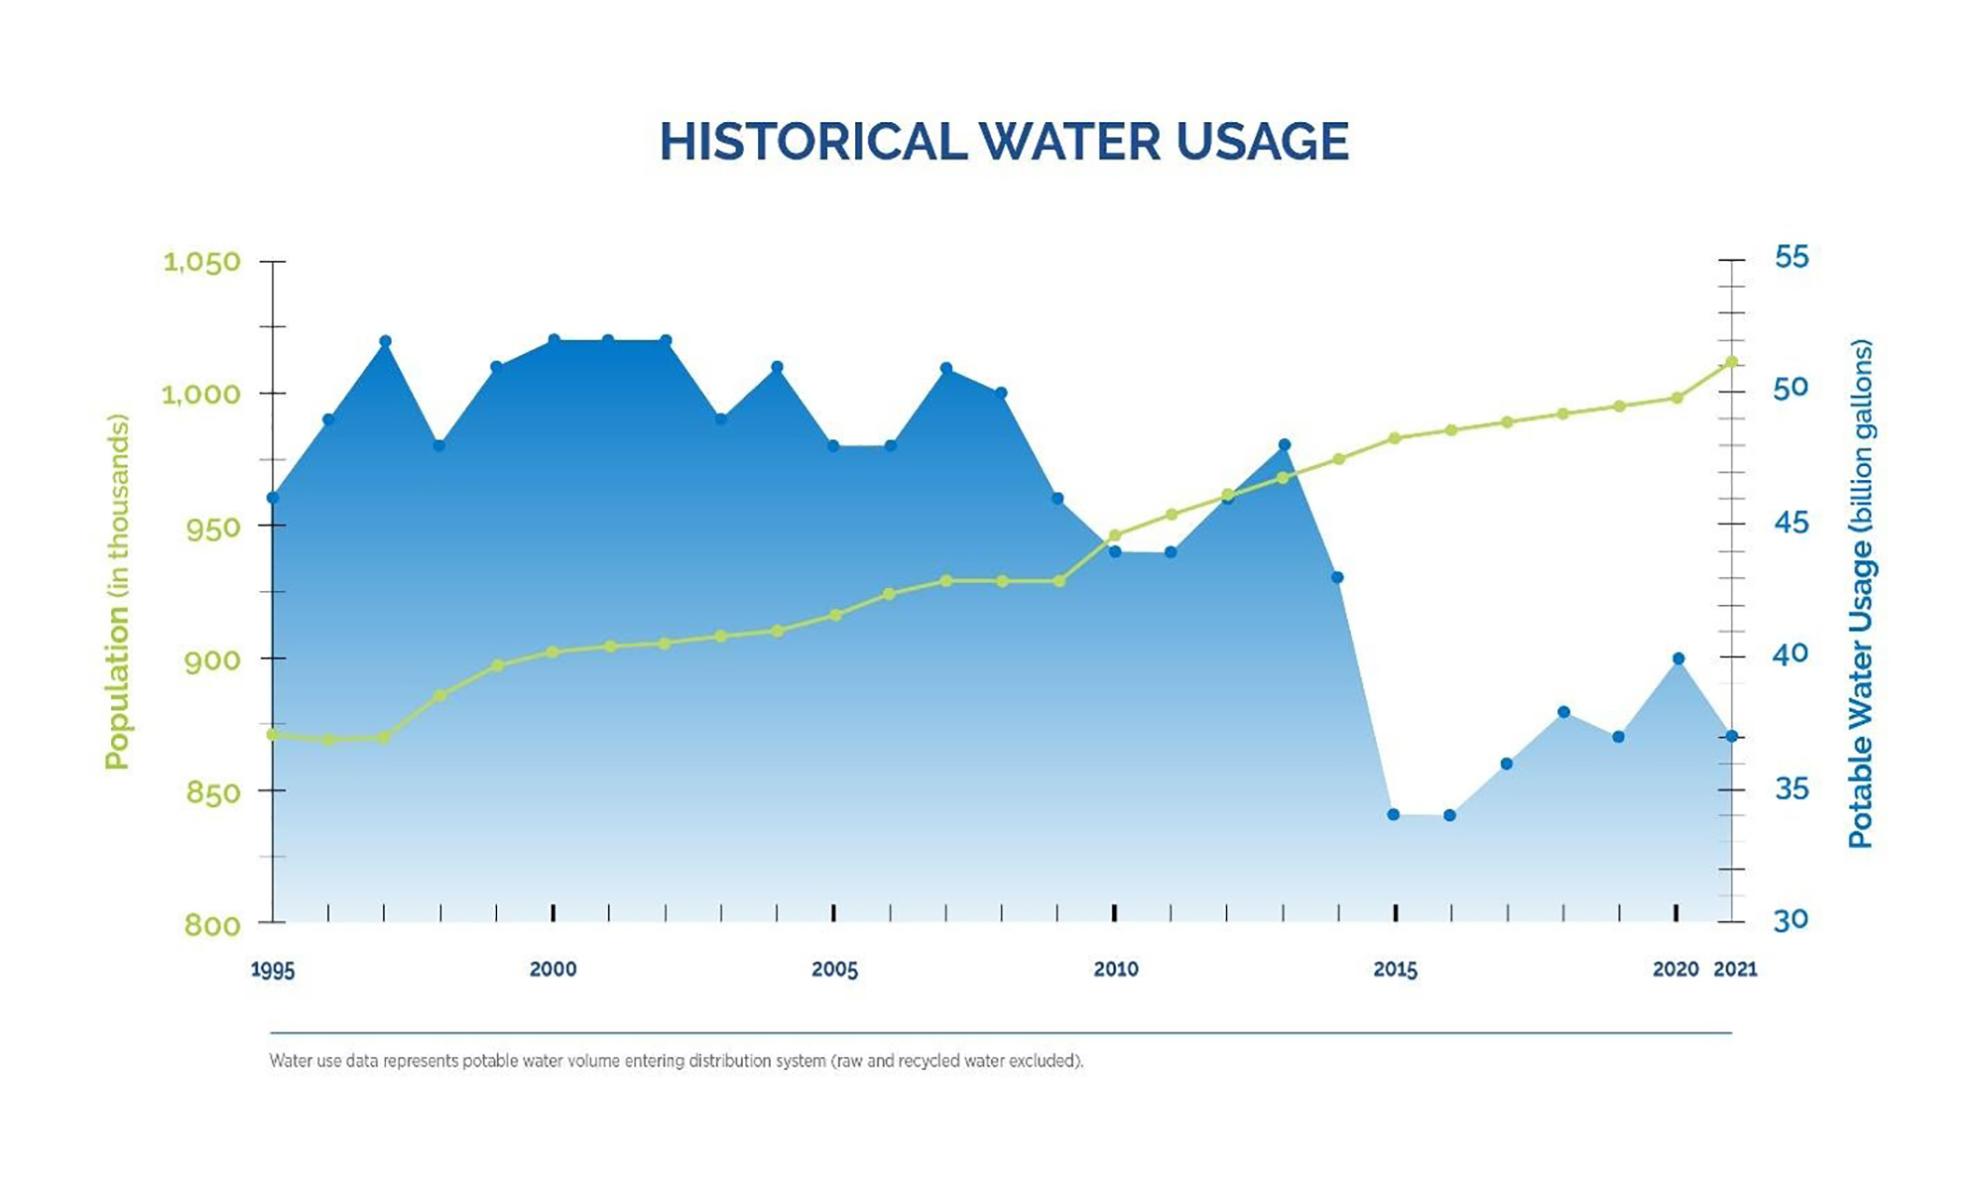
Over time, the population in the greater San Jose area has grown substantially. But, SJW is distributing less water now than it did in 1994! This interesting fact is shown in the chart below.

Despite the enormous amount of building since 1994, customers are using less water. How is that possible? The way we use water has changed. New water efficiency standards such as the EPA’s Water Sense Program helps save water in faucets, toilets and urinals. You can’t buy a toilet that use 5-7 gallons per flush when today’s standards are 1.28 gallons per flush.
Recycled water also makes up about 2% of our total water supply – allowing freshwater to be used for other uses. Landscaping is the #1 use for recycled water in our service area.
DWR Drought Survey
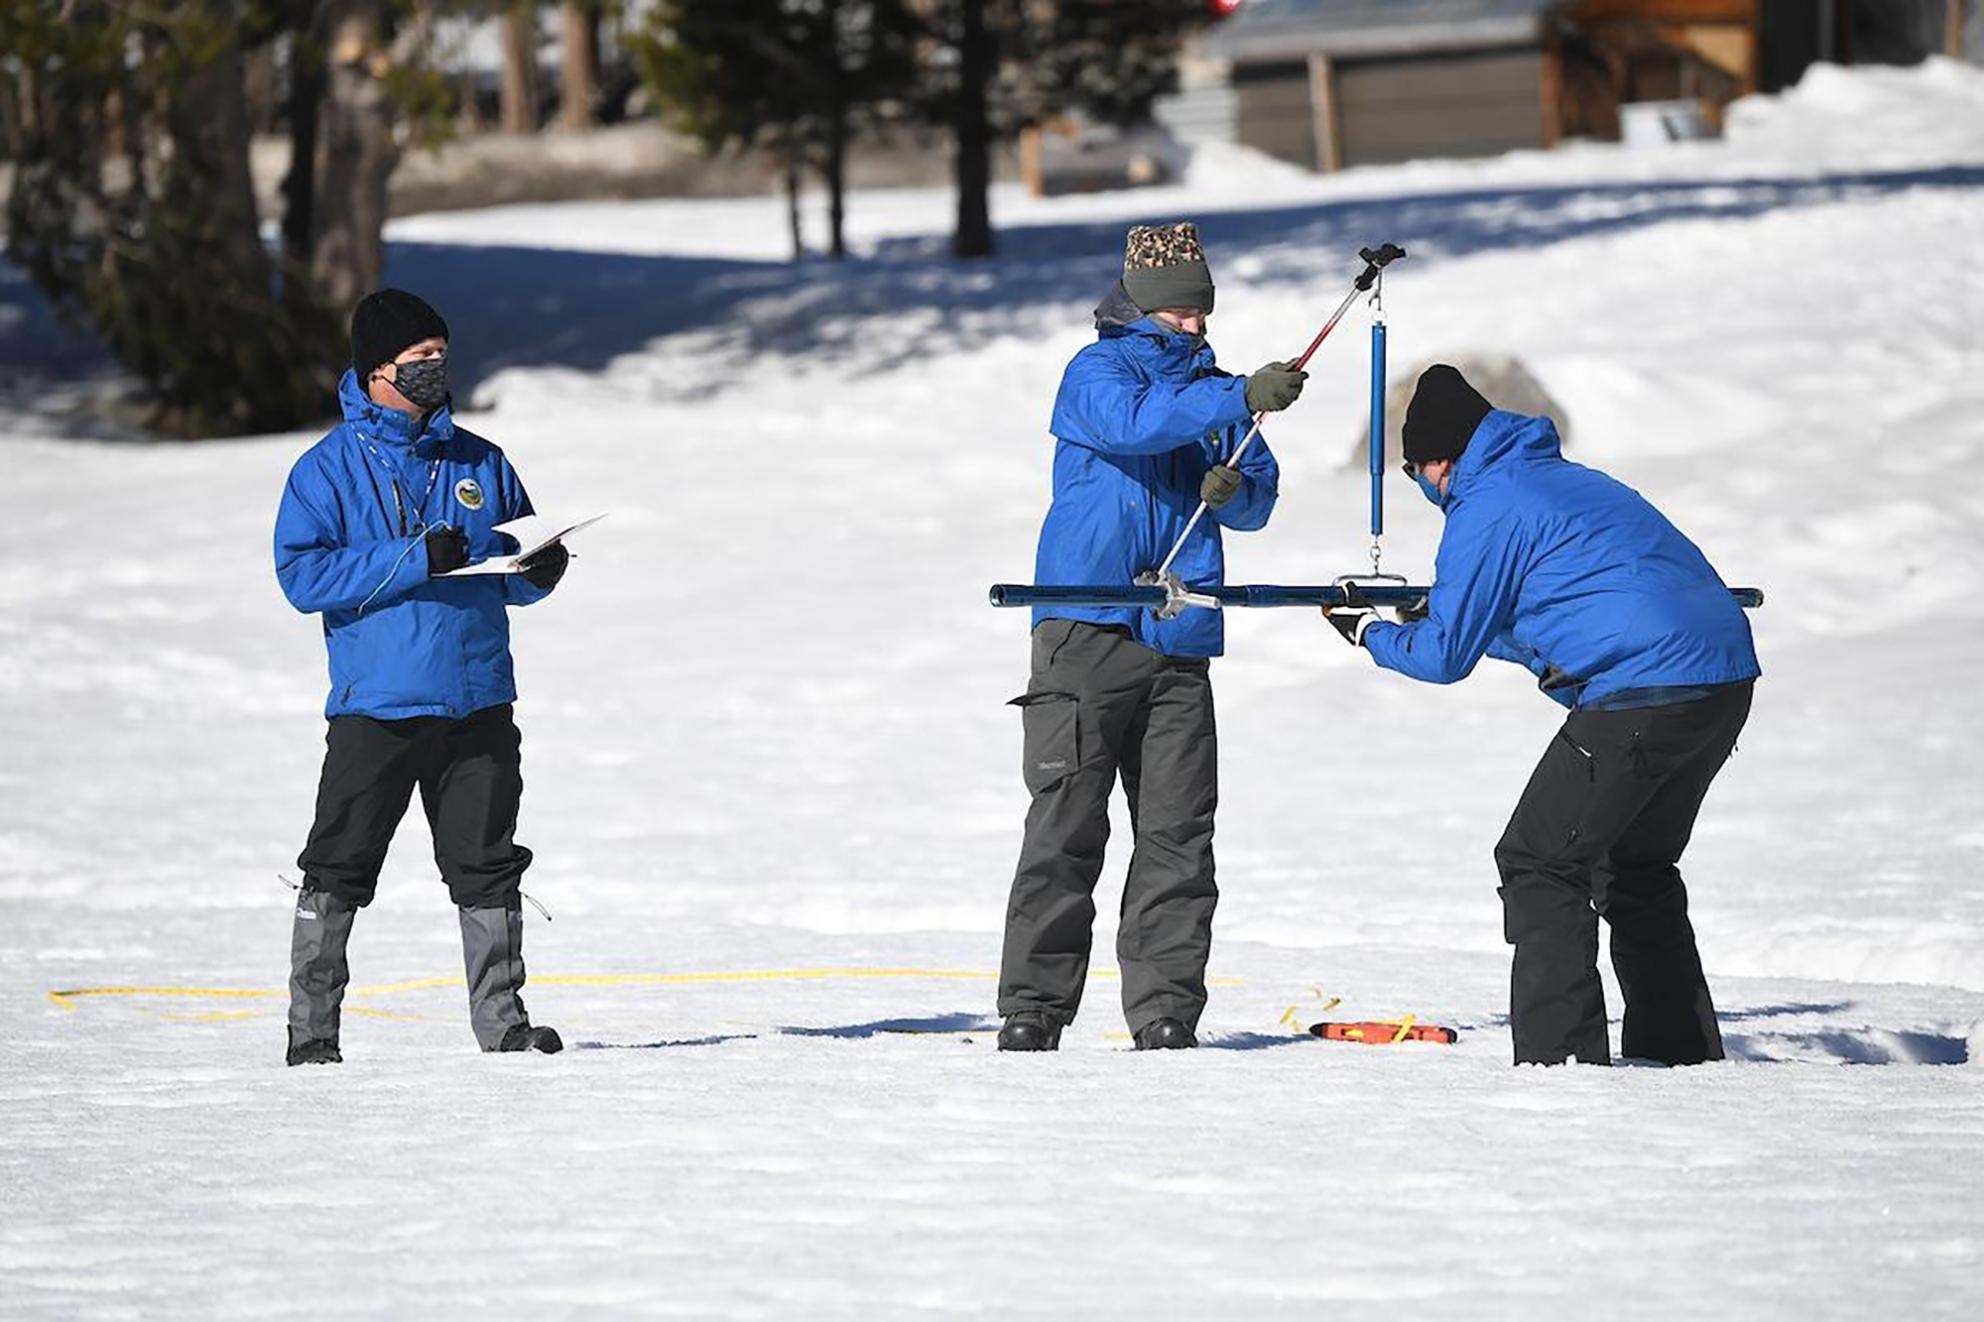
On February 1, 2022, the CA Department of Water Resources conducted the second snow survey of the season. After a dry January, the survey showed 48.5 inches of snow depth and a snow water equivalent of 19 inches. That’s 109% of average for this location.
Statewide, the snowpack is 92% of average for this date. But, most surveys in the area after the December storms showed 150% of average. Dry weather has a significant impacts on these numbers.
“We are definitely still in a drought. A completely dry January shows how quickly surpluses can disappear,” said DWR Director Karla Nemeth. “The variability of California weather proves that nothing is guaranteed and further emphasizes the need to conserve and continue preparing for a possible third dry year.”

Photo Credit: Department of Water Resources
