Page Hero Block
System Improvements
Block Group
Image Block
Spacer - Extra Small
Text Block - Normal - Left
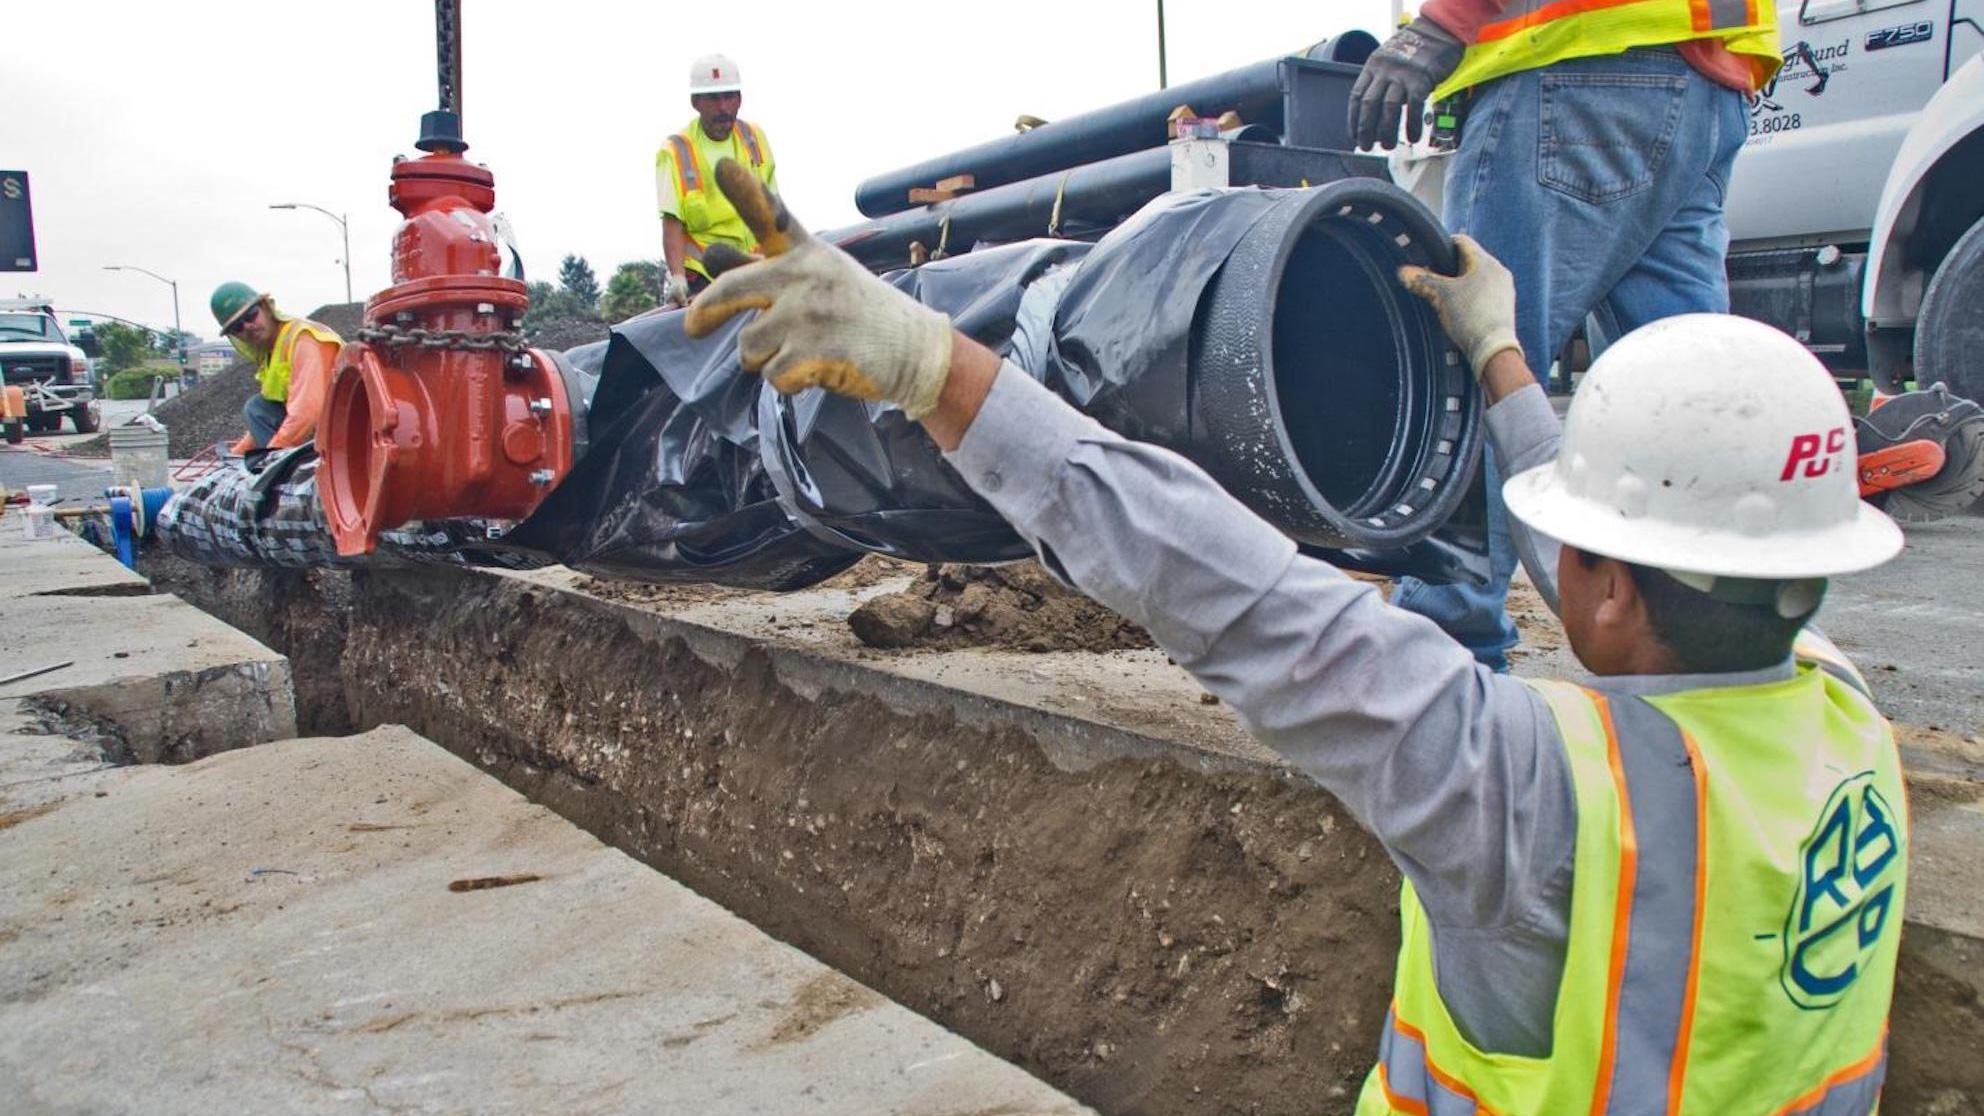
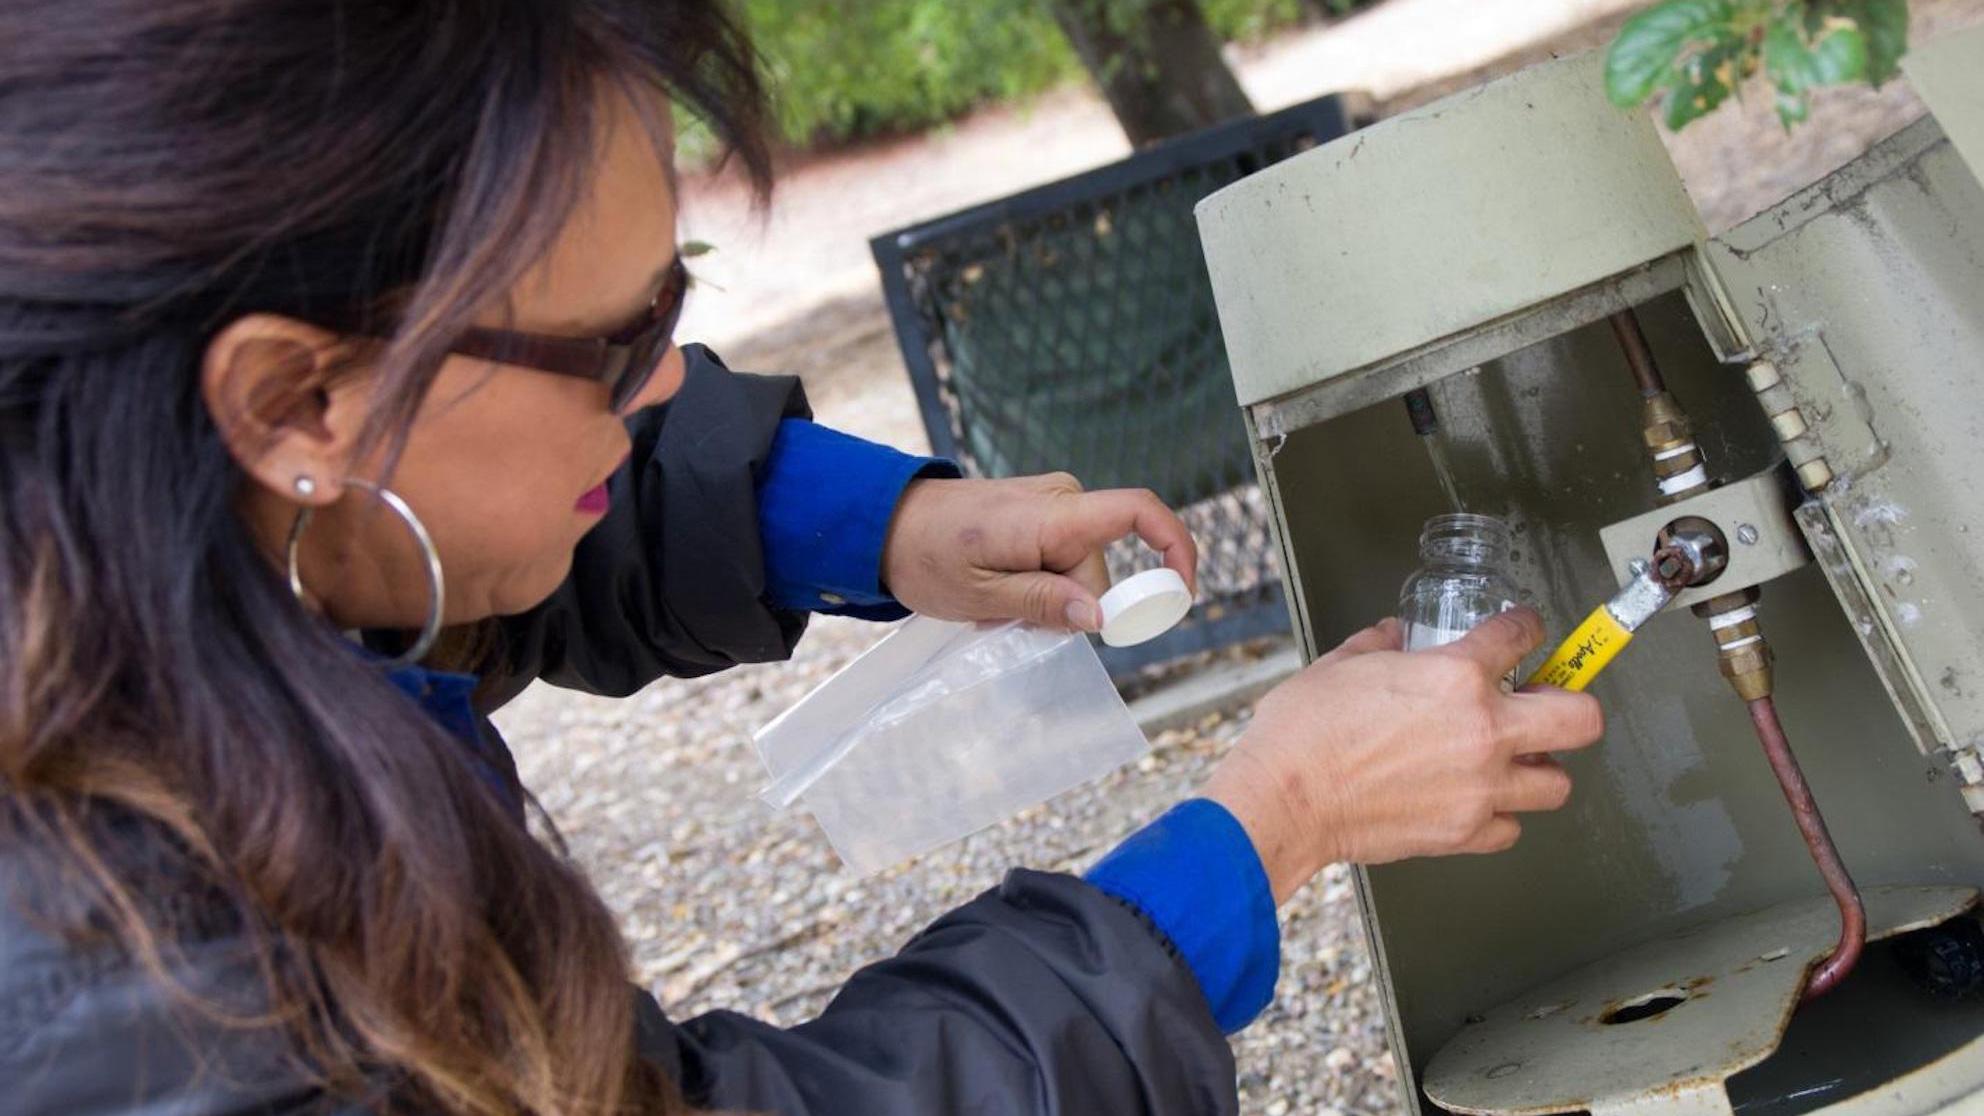
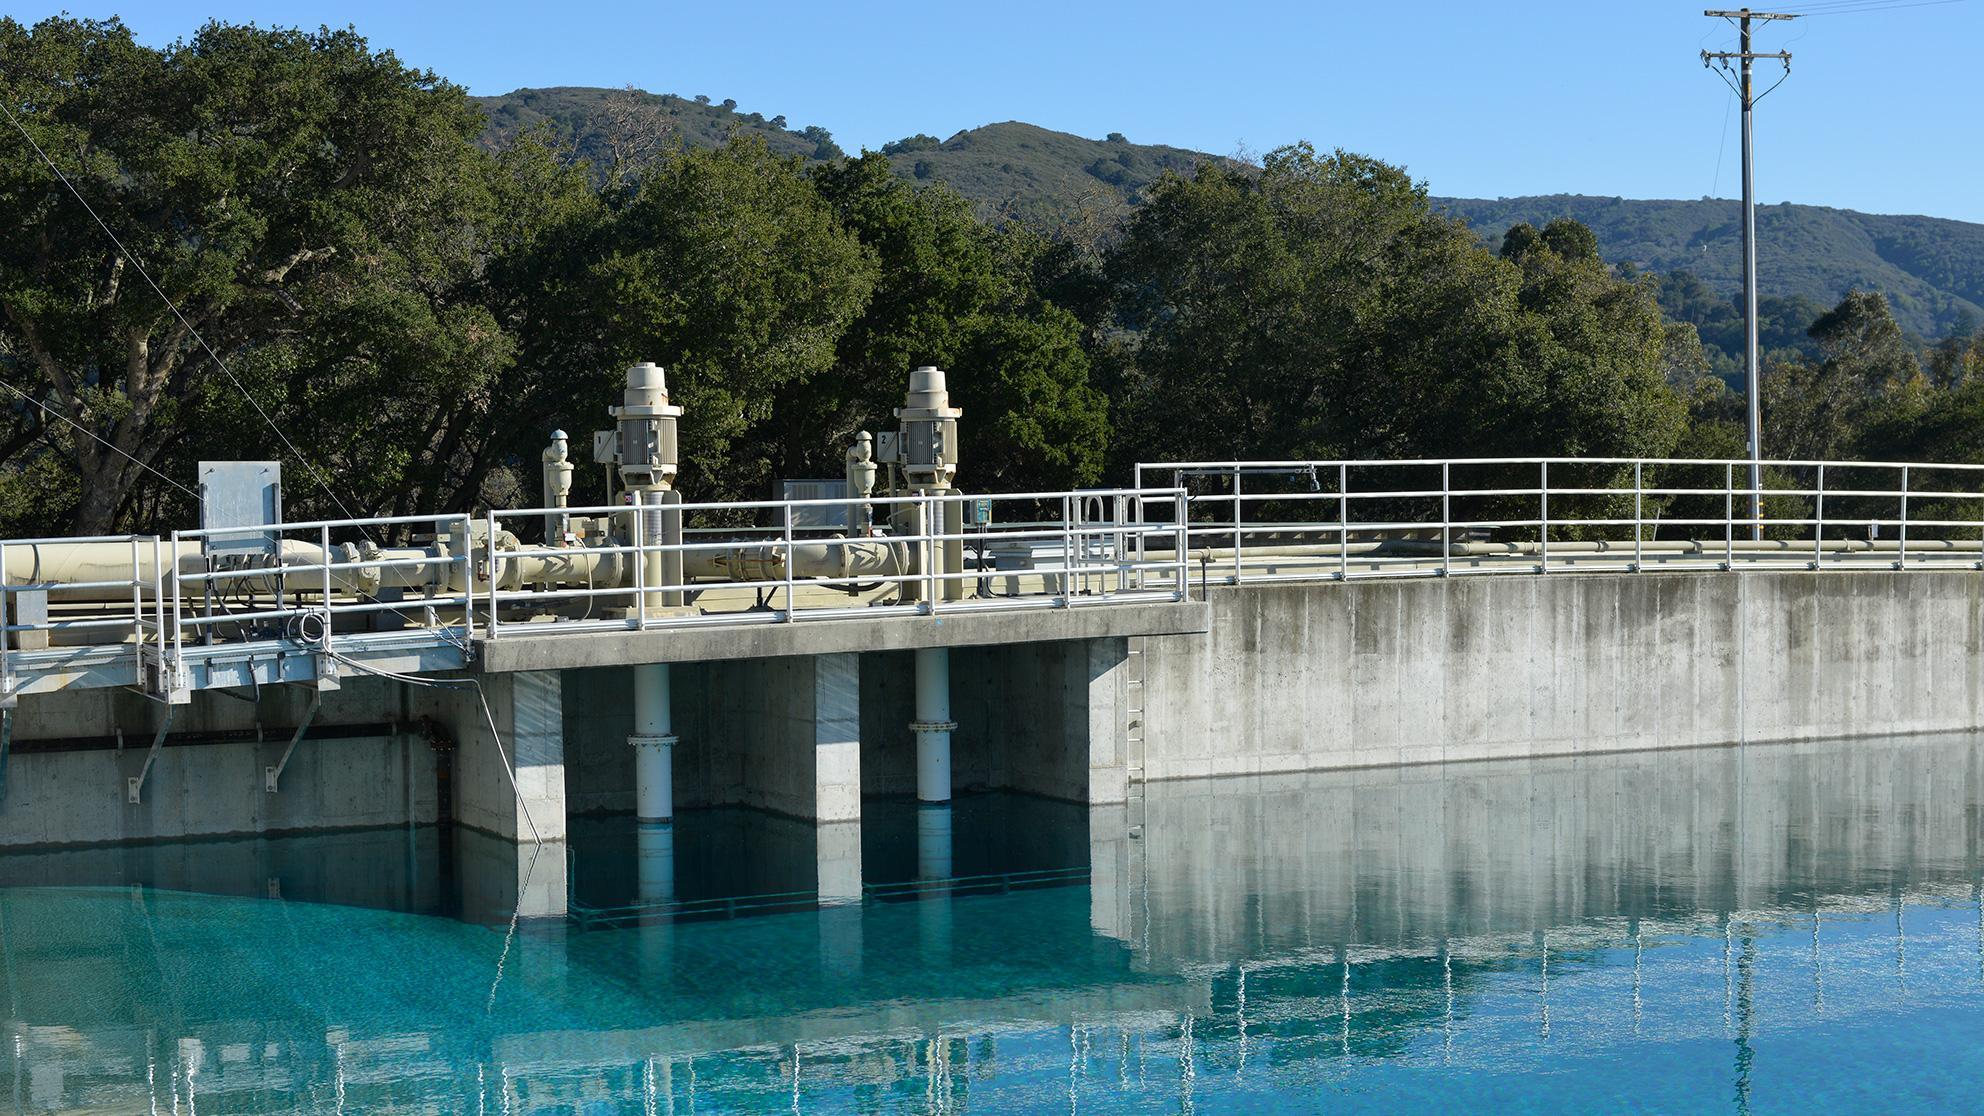
San Jose Water is committed to providing safe, high-quality, reliable water. To ensure this, we continually invest in our system and upgrade older infrastructure.
Pipes have a useful life of 100 years or less. We have made a commitment to replace 1% of our system or 24 miles of pipes annually to meet that 100-year turnover. Over the past decade, we have invested more than $1 billion in capital infrastructure on behalf of the communities we serve.
Below is a summary of SJW’s infrastructure investment by community served for the period of 2013 through 2017, and separately for the General Rates Cases (GRC) 2018-2020 and 2021-2023.
Text Block - Normal - Left
For 2021-2023 General Rate Case Application
| Jurisdiction | Transmission & Distribution (T&D) | Non-T&D or TBD Locations | Total By Jurisdiction |
| Campbell | $3,180,258 | $4,057,826 | $7,238,084 |
| Cupertino | $16,803,732 | $2,432,242 | $19,235,974 |
| Los Gatos | $15,824,142 | $3,637,042 | $19,461,184 |
| Monte Sereno | $595,502 | $222,342 | $817,844 |
| San Jose | $243,415,206 | $54,599,660 | $298,014,866 |
| Saratoga | $24,288,615 | $3,411,240 | $27,699,855 |
| Unincorporated | $59,256,245 | $2,996,747 | $62,252,992 |
| Total | $363,363,700 | $71,357,099 | $434,720,799 |
Spacer - Extra Small
Text Block - Normal - Left
For 2018-2020 General Rate Case Application
| Jurisdiction | Transmission/Distribution | Non-Mains | Total By Jurisdiction |
|---|---|---|---|
| Campbell | $7,857,304 | $10,918,501.56 | $18,775,805 |
| Cupertino | $11,690,435 | $10,831,393.58 | $22,521,828 |
| Los Gatos | $14,257,084 | $9,439,601.61 | $23,696,686 |
| Monte Sereno | $9,268,084 | $1,036,584.98 | $10,304,628 |
| San Jose | $92,894,008 | $166,609,500.67 | $259,503,509 |
| Saratoga | $24,825,396 | $9,537,356.12 | $34,362,752 |
| Unincorporated | $23,455,330 | $9,353,461.49 | $32,808,791 |
| Total | $184,247,600 | $217,726,400 | $401,974,000 |
Spacer - Extra Small
Text Block - Normal - Left
For years 2013-2017
| Jurisdiction | Transmission/Distribution | Non-Mains | Total By Jurisdiction |
|---|---|---|---|
| Campbell | $19,875,970 | $12,170,837 | $32,046,807 |
| Cupertino | $21,699,840 | $12,073,738 | $33,773,578 |
| Los Gatos | $24,583,421 | $10,522,310 | $35,105,731 |
| Monte Sereno | $1,785,076 | $1,155,480 | $2,940,555 |
| San Jose | $197,473,485 | $185,719,356 | $383,192,841 |
| Saratoga | $19,362,488 | $10,631,276 | $29,993,764 |
| Unincorporated | $17,669,536 | $10,426,289 | $28,095,825 |
| Total | $302,449,815 | $242,699,286 | $545,149,101 |
Spacer - Extra Small
Two Column Layout Block
Text Block - Normal - Left
Image Block
Text Block - Normal - Left
Image Block
Spacer - Medium